

Cap rates get mentioned in nearly every real estate investing conversation, but the actual numbers — what’s real in a specific market right now — are tough to nail down. That’s especially true when sellers and their agents have every reason to quote figures that make their listing look more attractive than it actually is.
So here’s a straight answer about where cap rates actually stand in the Kansas City multifamily market, why they matter more than ever in today’s environment, and how to put them to work practically when you’re sizing up a deal.
What Is a Cap Rate, Really?
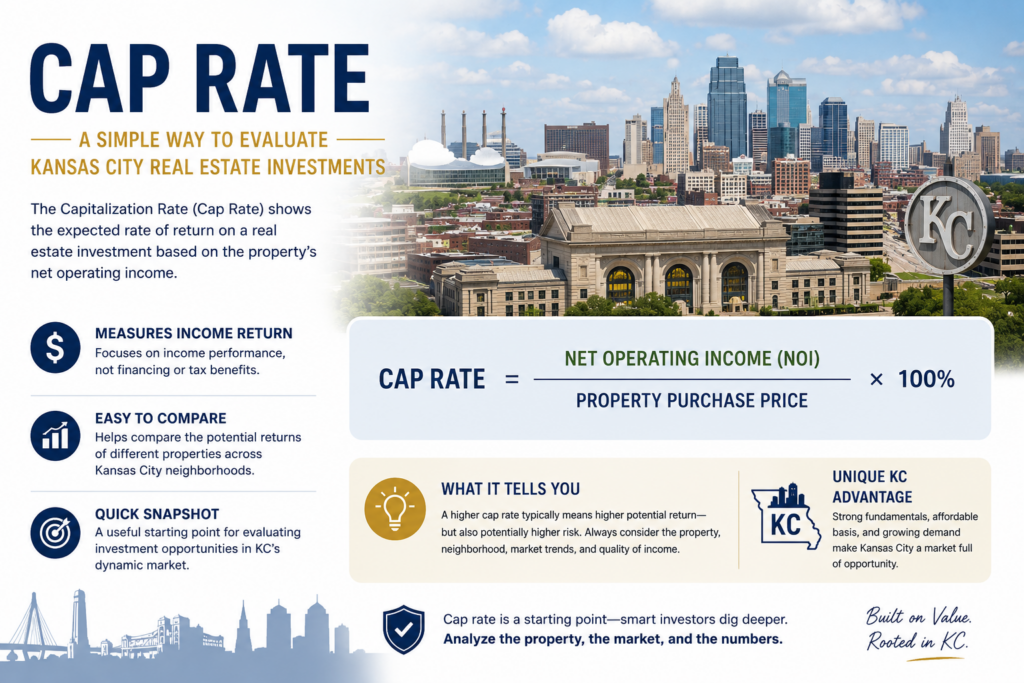
Quick level-set for anyone who needs it. A capitalization rate is simply the ratio of a property’s net operating income to its purchase price.
Cap Rate = Net Operating Income ÷ Purchase Price
If a property generates $30,000 in NOI per year and sells for $400,000, the cap rate is 7.5%.
Cap rates move inversely to price — a lower cap rate means you’re paying more for each dollar of income. When the market was hot in 2021 and 2022, buyers were accepting 4–5% cap rates on Kansas City multifamily because cheap debt made the math work. At 3.5% interest rates, you could buy at a 5% cap and still cash flow reasonably well.
That math doesn’t work anymore.
What’s Happened to Cap Rates Since 2022
When interest rates moved from the 3–4% range up to 6.5–7%+, the entire equation for income property changed. Suddenly, a property priced at a 5% cap rate had negative leverage — meaning the cost of the debt was higher than what the property was earning. That’s not investing. That’s paying to own a problem.
Buyers adjusted. The prices they were willing to pay came down to reflect the new cost of capital. But sellers — many of whom bought or refinanced at low rates and have a specific number they need — didn’t move as fast. That gap between what buyers need to pay to make a deal work and what sellers are asking is exactly why so many Kansas City multifamily listings are sitting right now.
The market is in the middle of a repricing. It’s happening, but it’s slow.
Kansas City Cap Rates by Submarket (Mid-2025 Reality Check)
I want to be clear that cap rates vary significantly based on property condition, unit mix, submarket, and tenant profile. These are general ranges based on what I’m actually seeing trade in the market — not what’s being listed, but what’s actually closing.
Kansas City proper (desirable neighborhoods — Brookside, Waldo, Waldo-adjacent, Midtown): Well-maintained 2–4 unit properties in the best KC neighborhoods have compressed cap rates because demand is high and vacancy is low. Realistic trading cap rates are in the 5.5–6.5% range for stabilized, turnkey properties. Anything listed at a 5% cap here isn’t priced wrong for the neighborhood — it’s just priced for the one buyer who doesn’t need the deal to cash flow.
Kansas City proper (improving or transitional areas): Neighborhoods that are gentrifying or have mixed demand need to offer more yield to compensate for risk. Realistic cap rates here are 7–8.5%, sometimes higher for properties with deferred maintenance or management challenges.
Independence, Raytown, Blue Springs: These east side suburbs have consistent rental demand and reasonable price points. Realistic cap rates for stabilized properties are in the 7–8% range. There’s more inventory here and sellers have generally been more willing to negotiate.
Kansas City, KS (Wyandotte County): Lower price points, higher gross yields, but also higher management intensity and more risk. Properties can show cap rates of 8–10%+ on paper, but the actual collection rates and maintenance costs need to be scrutinized carefully. The yield looks good until you run real numbers.
North KC, Gladstone, Liberty: Solid suburban rental markets with decent fundamentals. Stabilized 2–4 unit properties are trading in the 6.5–7.5% range depending on condition and specific location.
Overland Park, Lenexa, Olathe (Johnson County, KS): Lower cap rates because of the premium for Johnson County schools and demographics. Expect 5.5–6.5% for quality properties. The upside is lower vacancy risk and stronger rent growth.
How to Use Cap Rates When Evaluating a Deal
Here’s how I actually use this in practice with buyer clients.
Step 1: Build your own NOI. Don’t use the listing’s NOI. Use actual rents, normalize expenses to realistic levels (45–55% expense ratio for small multifamily), and calculate your own number.
Step 2: Apply the submarket cap rate. Take your NOI and divide it by the appropriate cap rate for that neighborhood. That gives you a supportable value — what the property is worth given what it earns and what the market demands as a return.
Step 3: Compare to asking price. If your supportable value is $350,000 and the seller is asking $430,000, you have an $80,000 gap. That gap either needs to come off the price or needs to be explained by something — a below-market rent situation with clear upside, a value-add opportunity, something concrete.
Step 4: Check debt service. Even if the cap rate works on paper, verify that the NOI covers the debt at current rates with a comfortable cushion. The rule of thumb I use is a Debt Service Coverage Ratio of at least 1.2 — meaning the property earns 20% more than it costs to service the debt.
The Cap Rate Trap to Avoid
One thing worth flagging: some sellers and agents will show you a cap rate based on projected rents after improvements — what the property will earn once you fix it up. That’s called a stabilized or pro forma cap rate, and it’s not what you’re buying today.
You’re buying the property at its current income. If you’re planning to improve it and raise rents, that’s legitimate — but the value of that upside belongs to you, not the seller. Don’t pay for potential the current owner never realized.
Always ask: is this cap rate based on actual current rents or projected rents? The answer tells you a lot.
What This Means for Buyers Right Now
If you’re shopping for 2–4 unit properties in Kansas City and you keep finding that nothing pencils out, the cap rates above explain why. A lot of what’s listed is priced to 2021 cap rates with 2025 interest rates — and that math simply doesn’t work.
The deals that do work are either priced right from the start (rare, and they move fast), found off-market before they’re tested at an inflated price, or are listings that have been sitting long enough that the seller is ready to meet reality.
Knowing the market cap rates in Kansas City or for your target submarket gives you the foundation to evaluate every deal quickly, make offers that you can defend with data, and recognize a genuine opportunity when it shows up.
If you want to talk through specific properties you’re looking at — or you want to know what’s realistically available right now in a particular KC submarket — I’m glad to help.
Call or text Brian at (913) 708-1185, or reach out at bdrealestatesolutions.com.
BD Real Estate Solutions | Kansas City Multifamily & Investment Property Specialist | Serving Kansas City, Independence, Lawrence, Topeka, and surrounding areas
Related Reading
- Why Kansas City Multifamily Listings Look Overpriced — And How to Find Deals Anyway
- How to Evaluate a Multifamily Investment Property in Kansas City
- Off-Market vs. MLS: Where Kansas City Investors Actually Find Deals